
An animated dive into the dusty Milky Way reveals the outlines of our galaxy taking shape as we look out further and further from Earth. Based on new data from an interactive tool that exploits data from the European Space Agency’s Gaia mission and other space science data sets, astronomers have created an animation to model dust in the Milky Way. The work was presented this week at the National Astronomy Meeting (NAM 2022) at the University of Warwick.
The dusty Milky Way
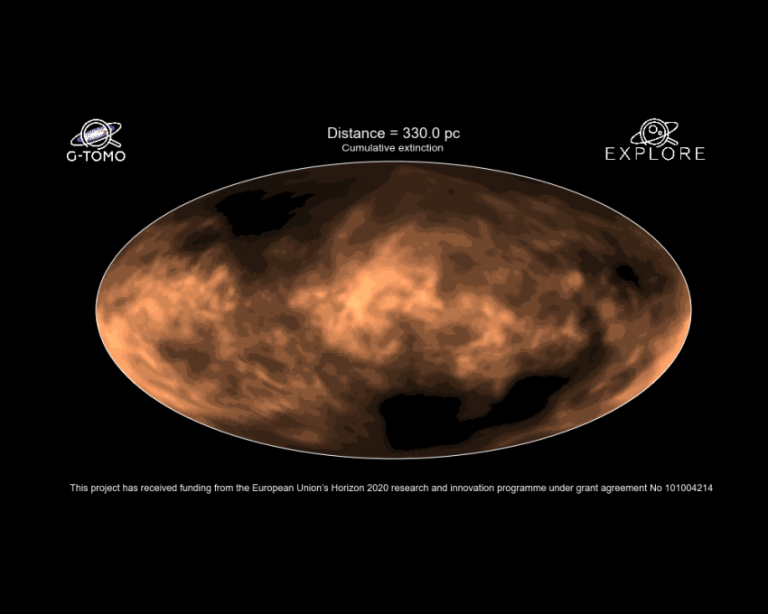
The animation shows the cumulative build-up of dust looking from Earth’s local neighborhood to ~13,000 light-years toward the galactic center — around 10 percent of the overall distance across the Milky Way. Close by, dust swirls all around, but, further out, the concentration of dust along the galactic plane becomes clear. Two “windows,” one above and one below the galactic plane, are also revealed. Nick Cox, the coordinator of the EXPLORE project that is developing the tools, said:
“Dust clouds are related to the formation and death of stars, so their distribution tells a story of how structures formed in the galaxy and how the galaxy evolves. The maps are also important for cosmologists in revealing regions where there is no dust and we can have a clear, unobstructed view out of the Milky Way to study the Universe beyond, such as to make Deep Field observations with Hubble or the new James Webb Space Telescope.”
The tools used to create the animation combine data from the Gaia mission and the 2MASS All Sky Survey. The tools are part of a suite of applications designed to support studies of stars and galaxies, as well as lunar exploration, and have been developed through funding from the European Union’s Horizon 2020 Programme. Albert Zijlstra, of the University of Manchester and the EXPLORE project, said:
“State-of-the-art machine learning and visual analytics have the power to greatly enhance scientific return and discovery for space science missions, but their use is still relatively novel in the field of astronomy. With a constant stream of new data, such as the recent third release of Gaia data in June 2022, we have an increasing wealth of information to mine — beyond the scope of what humans could process in a lifetime. We need tools like the ones we are developing for EXPLORE to support scientific discovery, such as by helping us to characterise properties within the data, or to pick out the most interesting or unusual features and structures.”
Provided by Royal Astronomical Society [Note: Materials may be edited for content and length.]


